Puzzle Cube Design Challenge:

Why were the above measurements taken?
The measurements in the above excel spreadsheet were taken with a dial caliper, measuring on the endgrain of the 3/4^2 wood block. These measurements and data were collected to ensure that the blocks would be in acceptable tolerance to use in the project. Tolerance is the accepted range of values. Any block outside of + or - 2/100 of an inch would be out of tolerance. In data evaluation on the spreadsheet i calculated standard deviation by plugging the formula in on the excel spreadsheet. The first deviation is shows that the low end number is .752 (where I subtracted the standard deviation from the mean), the mean of the data is .754, the high number of the first deviation is .757(where I added the standard deviation to the mean), and that 74% of the data is found in the first deviation. For the second deviation I got the low number by subtracting two times the standard deviation from the mean, I got the high end number by adding 2x the standard deviation. 90.5% of my cubes were found within this deviation. For the third deviation I got the low number by subtracting three times the standard deviation from the mean, I got the high end number by adding 3x the standard deviation. 100% of my cubes were found within this deviation.
The measurements in the above excel spreadsheet were taken with a dial caliper, measuring on the endgrain of the 3/4^2 wood block. These measurements and data were collected to ensure that the blocks would be in acceptable tolerance to use in the project. Tolerance is the accepted range of values. Any block outside of + or - 2/100 of an inch would be out of tolerance. In data evaluation on the spreadsheet i calculated standard deviation by plugging the formula in on the excel spreadsheet. The first deviation is shows that the low end number is .752 (where I subtracted the standard deviation from the mean), the mean of the data is .754, the high number of the first deviation is .757(where I added the standard deviation to the mean), and that 74% of the data is found in the first deviation. For the second deviation I got the low number by subtracting two times the standard deviation from the mean, I got the high end number by adding 2x the standard deviation. 90.5% of my cubes were found within this deviation. For the third deviation I got the low number by subtracting three times the standard deviation from the mean, I got the high end number by adding 3x the standard deviation. 100% of my cubes were found within this deviation.
Inventor Slideshow:
Inventor Technical Drawings:
Hand Drawings:
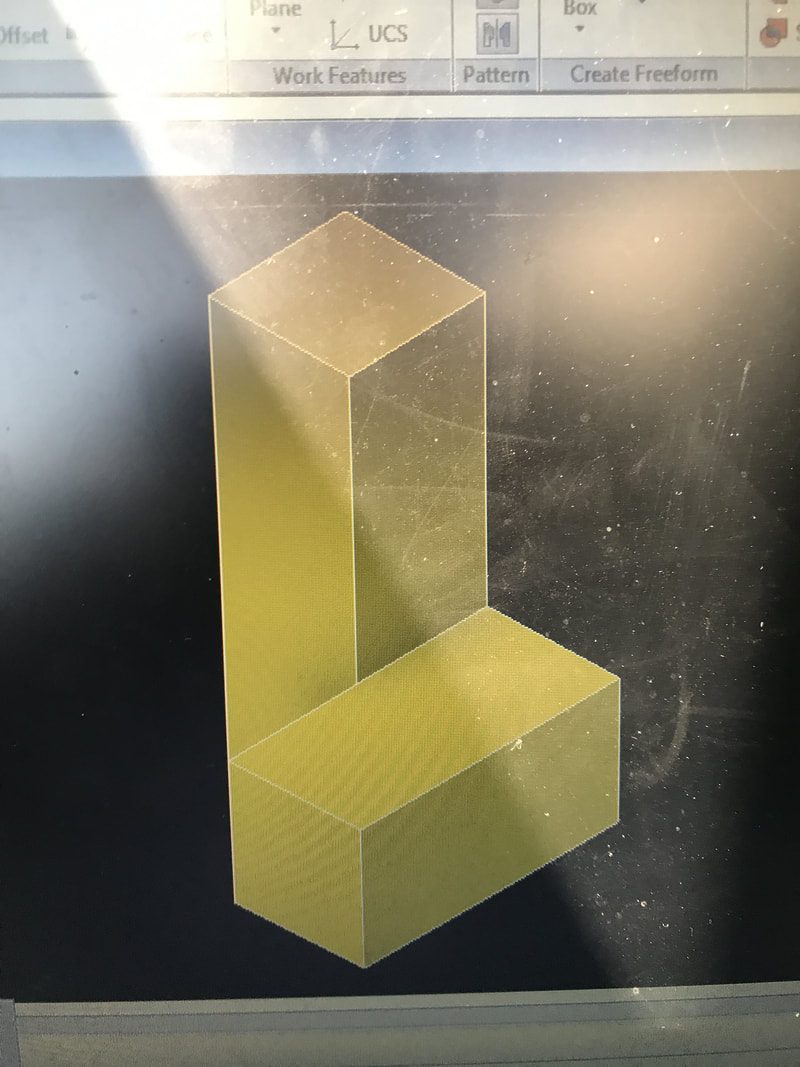
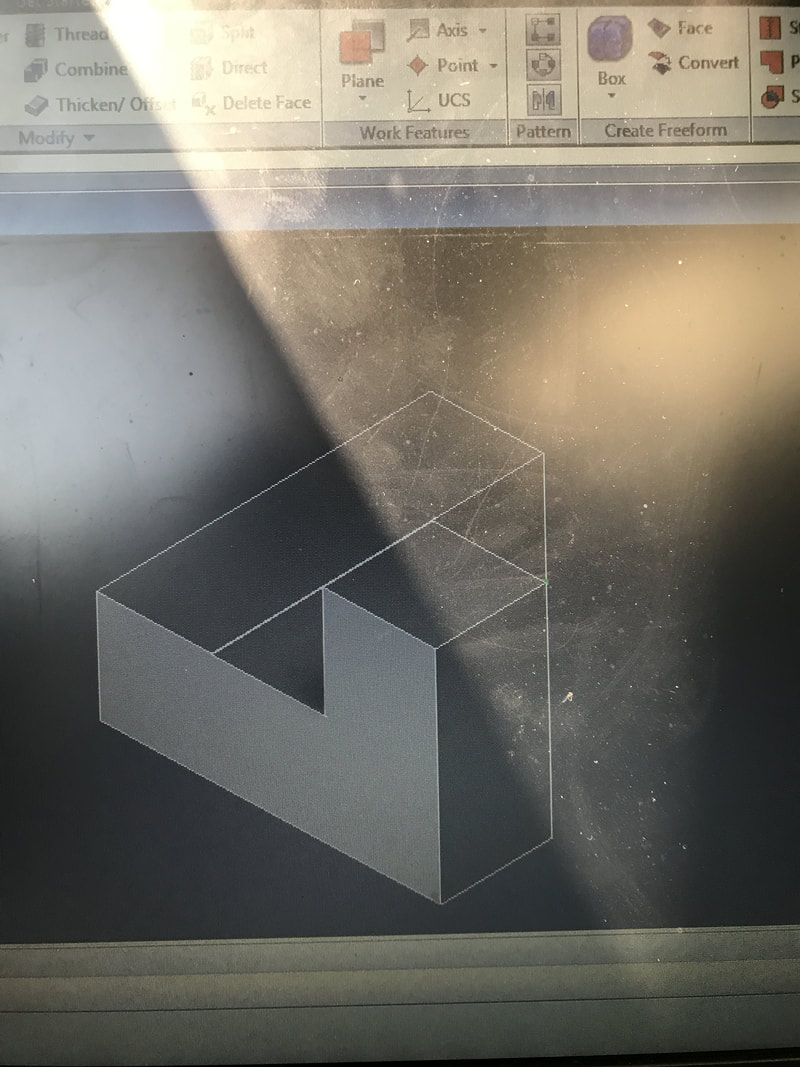
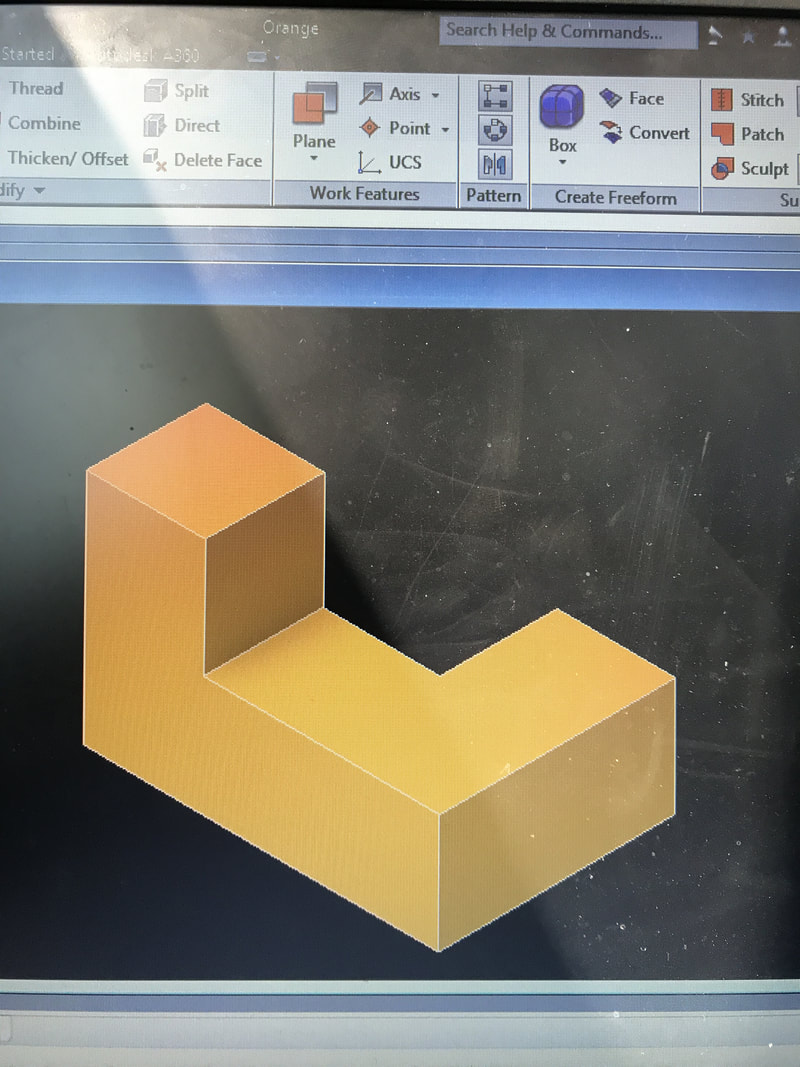
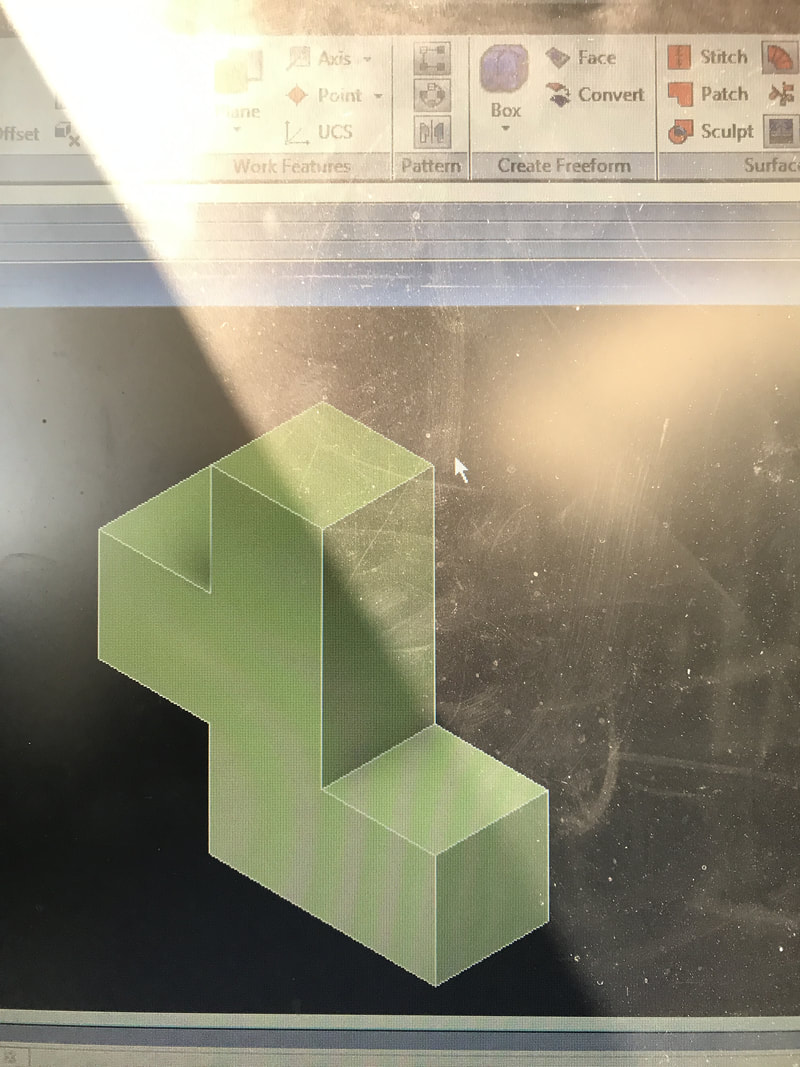
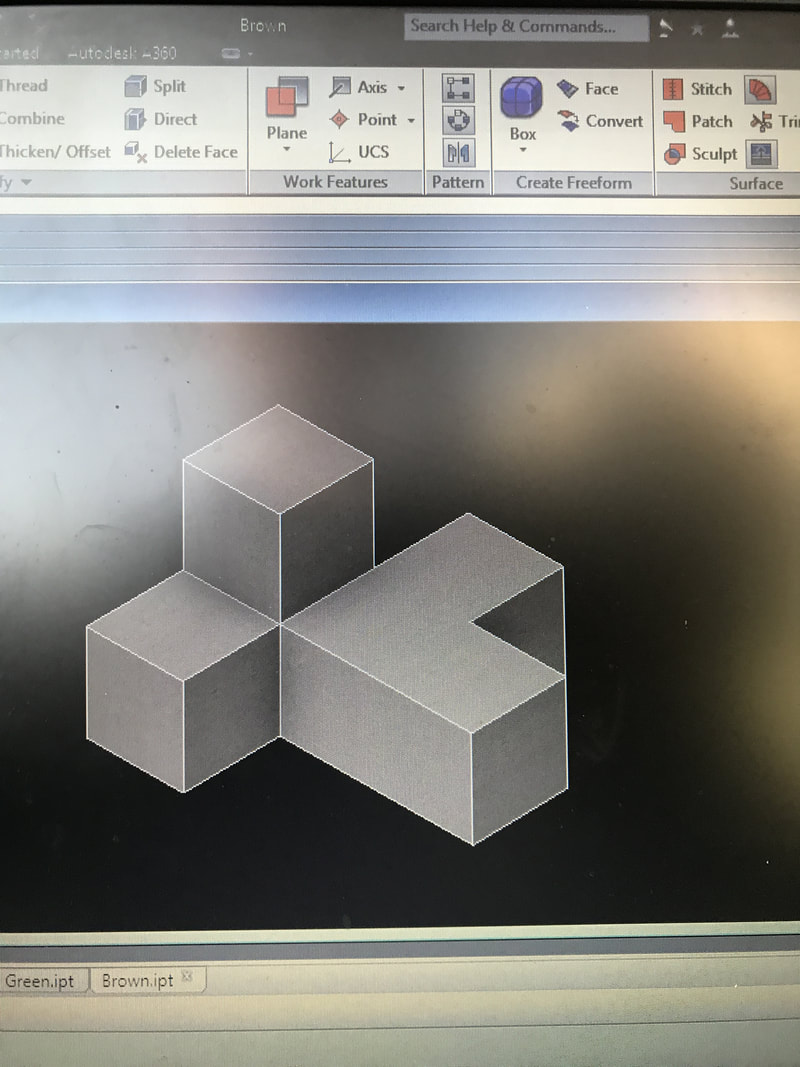
All of the sketches shown above except the multi-view drawings are isometric drawings. The brainstorming sketches (the slide with the numbered pieces) were done to create many possible solutions (in the form of individual pieces) to the design constraints given.
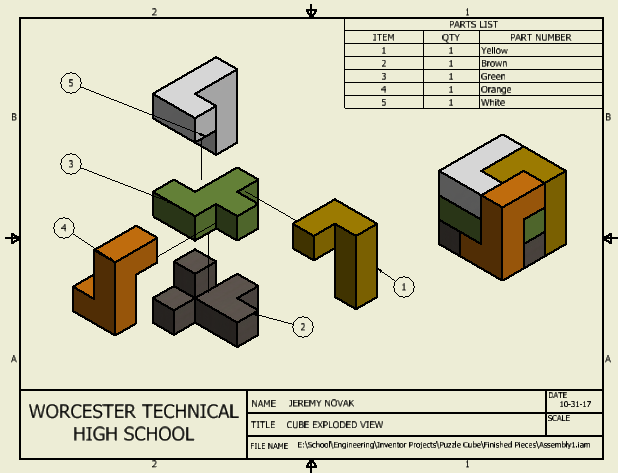
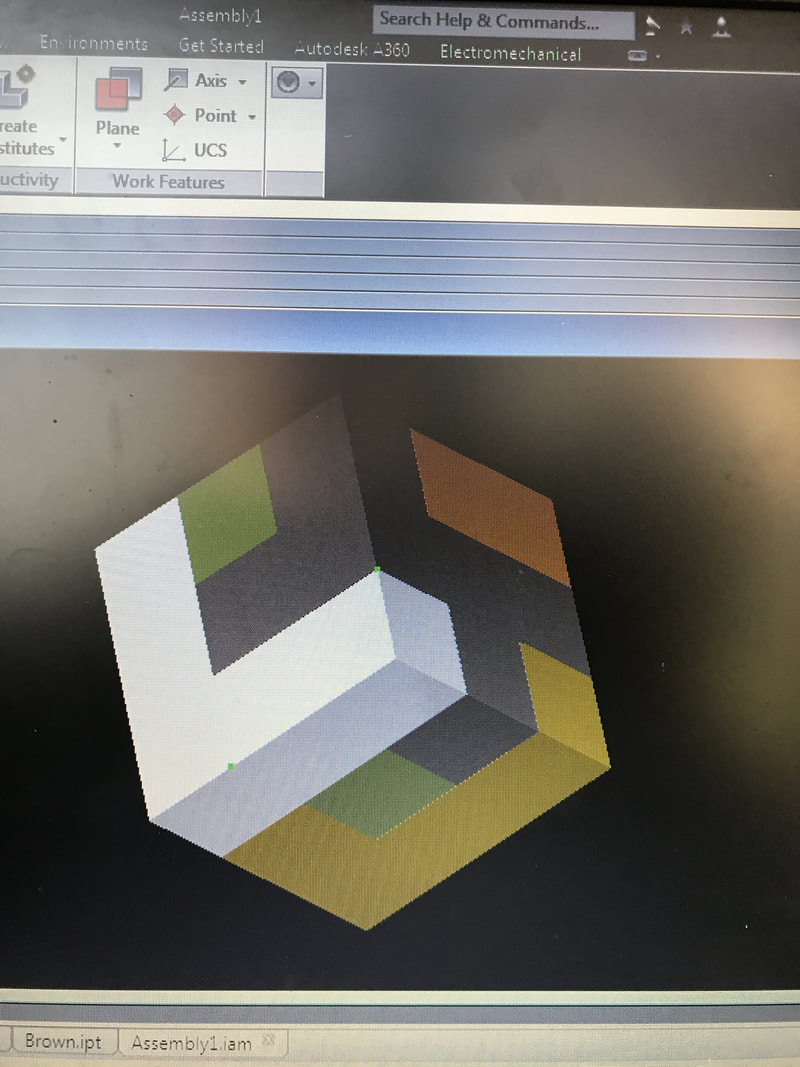
An unconstrained object has 6 degrees of freedom. A degree of freedom is what direction an object is allowed to move freely. When constrained by mate it is not free to move side to side, rotate, or up and down. When mate is applied again to another side, 3 more degrees of freedom are taken away. The object now cannot rotate or translate in any direction. Mate itself takes away 3 degrees of freedom on any object. Mate constrains the object to one plane. Flush takes away 3 degrees of freedom on any object. Flush constrains the object to one plane.
Evaluating the Solution:
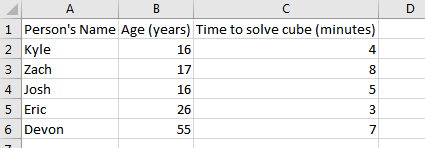
With this particular cube there is no correlation between the age of the person solving the puzzle cube and the time it took to solve the cube. With this being said, the sample size of 5 people in my experiment is not large enough to represent to entire population. If the sample size was 50 people per age in years there might be a realistic result to represent the entire population. I would not change anything in the design of my cube because it was challenging to everyone but not so hard that it would make someone give up before completing the puzzle.
Presenting the Solution:
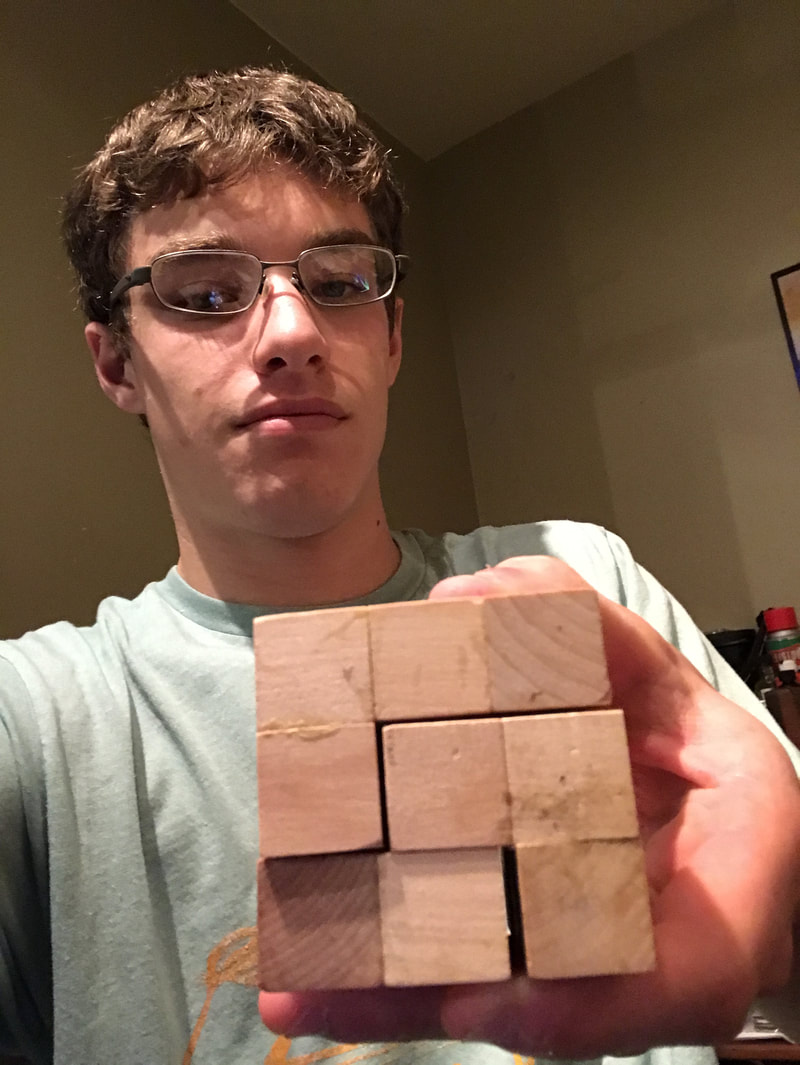
When someone says, "I used a design process to solve the problem at hand." they are saying that they followed a process while designing a given object. In this case, I followed the engineering design process to solve the problem given to me. The engineering design process was further elaborated by rubric given to me to complete this project. In the Define a problem stage I created a design brief. In the generate concepts stage I; created an excel document with a histogram, explained how and why I took the measurements, explained acceptable range and my tolerances, made brainstorming sketches and explained why they were made, and modeled my pieces on inventor. During the develop a solution stage I; made my flip book sketch, made multi-view sketches by hand, and made technical drawing s on inventor. During the construct and test the prototype stage I; took a picture of my fully assembled cube, made an assembly drawing on inventor, and made a exploded diagram on inventor. In the evaluate the solution stage I; got 5 people of all different ages to solve my cube, timed them, and recorded the data on an excel spreadsheet, and analyzed the data on this website. This whole paragraph, website, and the picture of me holding my finished cube is the presenting the solution stage of the engineering design process.
